Abstract
The purpose of this study was to examine the effects and predictive power of the Diagnostic Assessment and Achievement of College Skills (DAACS) on student success. DAACS is a diagnostic assessment tool designed to measure college students’ reading, writing, mathematics, and self-regulated learning skills and provide them with feedback and resources to enhance their success. DAACS was embedded into new student orientation in Fall 2020 at a brick-and-mortar university. Of 2,389 enrolled students, 465 students completed the DAACS. Preliminary analyses indicate that the GPAs of students who completed DAACS were 0.35 points higher than students who did not complete DAACS.
Research Questions
- What are the effects of DAACS on students’ academic success, as measured by GPA?
- What is the predictive power of DAACS as compared to admissions test scores?
Method
In Summer 2022 students at the University at Albany were invited to complete the Diagnostic Assessment and Achievement of College Skills (DAACS). Of the 2,389 incomng students, 465 (19.5%) completed at least the self-regulated learning assessment. To address research question 1 and to adjust for the selection bias, propensity scores were estimated using logistic regression. With sufficient balance achieved (see the PSA tab), both stratification and propensity score matching were used to estimate the standardized effect size on FAll 2020 GPA.
For research question 2, correlations between SAT or ACT scores (note ACT scores were rescaled to the SAT metric) and Fall GPA were compared to DAACS scores correlated with Fall GPA.
Missing data was imputed using the mice (van Buuren & Groothuis-Oudshoorn, 2011) package in R. There was evidence that high school GPA and SAT or ACT scores were not missing at random. Missing value indicators were included in the logistic regression to estimate the propensity scores for these two variables (see summary table on the PSA tab).
Results
Propensity Score Analysis (RQ1)
Figure 3 plots the propensity scores (estimated using logistic regression) against Fall 2020 GPA with marginal density plots. Loess regression lines with 95% confidence intervals are provided. This figure suggests that students in the treatment had statistically significantly larger Fall GPAs then students in the control group across the entire propensity score range.
The table below provides estimated standardized effect sizes using both stratification and matching methods.
| PSA Method | ES | t | p |
|---|---|---|---|
| Stratification | 0.29 | 6.27 | < 0.01 |
| Matching | 0.35 | 14.41 | < 0.01 |
Prediction (RQ2)
The correlation between SAT and GPA is r = 0.158 (p < 0.01), which is smaller than the correlations between SAT and three of the four DAACS assessments (\(\rho_{GPA,SRL}=0.162\), p < 0.01; \(\rho_{GPA,Writing}\)=0.183, p < 0.01; \(\rho_{GPA,Math}=0.184\), p < 0.01). See Figure 4 for more details.
Figure 3. Propensity Score Assessment Plot
Figure 4. Correlation Plot of Fall 2020 GPA, Admission Test Scores, and DAACS scores
Use the two drop downs on the right to select up to two different variables to explore visually.
Propensity Score Analysis
Propensity score analysis was used to adjust for students’ self-selection into the treatment. The box on the right is the results of the logistic regression predicting treatment from the observed covariates. The fitted values from the logistic regression were used as the propensity scores which is interpreted as the conditional probability of being in the treatment (Rosenbaum & Rubin, 1983). Both matching (Sekhon, 2011) and stratification (using 10 strata; Helmreich & Pruzek, 2009) were used for estimating the average treatment effect (ATE). The figure below is the standardized effect size for each covariate before and after stratification by propensity scores. The results suggest that sufficient balance was achieved between treatment and control students with the standardized effect size being less than 0.1 (or less than 1% of variance) across all covariates.
Figure 1. Multiple Covariate Balance Assessment Plot
Logistic regression results estimating treatment.
Efficacy of the Diagnostic Assessment and Achievement of College Students for Traditional-Age College Students
Authors: Jason Bryer, Angela Lui, David Franklin, and Heidi Andrade
NOTE: DAACS was developed under grants #P116F150077 and #R305A210269 from the U.S. Department of Education. However, the contents do not necessarily represent the policy of the U.S. Department of Education, and you should not assume endorsement by the Federal Government.
Institutions of higher education often base assessments of student readiness for college on placement exams in reading, writing, and mathematics domains (Bailey & Cho, 2010; Belfield & Crosta, 2012). These types of assessments are helpful in identifying students who may be at risk for academic struggles and for facilitating placement in remedial or basic courses. However, placement exams do not lead to individualized student feedback regarding academic strengths and weaknesses, nor do they empower students to access resources designed to help them transition into college. In addition, typical placement exams fail to provide much, if any, information about the quality of nonacademic competencies needed to succeed in college, including and especially self-regulated learning (SRL), which is a malleable skill linked to student success (Zimmerman, et al., 2011; Zimmerman & Schunk, 2011).
Furthermore, according to the National Association for College Admission Counseling (2021), 1,450 institutions have moved to an admissions test-optional policy. Although the trend to test-optional policies has been occurring for years, the COVID-19 pandemic has accelerated it. With institutions reducing and/or eliminating their reliance on high-stakes admissions tests, there is a need for an alternative approach to measure and address issues of college readiness.
To address the shortcomings of traditional college readiness assessments, a no-stakes assessment and feedback system called Diagnostic Assessment and Achievement of College Skills (DAACS) was created to assess basic reading, writing, mathematics, and SRL skills that contribute to student success in college (see Table 1). By assessing and providing actionable feedback about three core academic skill areas, DAACS enhances students’ awareness of their strengths and helps to identify specific skills needing attention. The inclusion of an SRL assessment and feedback are of particular value because they can optimize students’ skills in managing challenges such as selecting and applying appropriate study strategies, time management, and fluctuations in motivation, among others (Zimmerman & Schunk, 2011).
The primary goal of DAACS is to enhance newly enrolled college students’ success in college by using their assessment results and individualized recommendations for actionable steps and resources. A secondary goal is to improve predictive models of student success. Randomized control trials of DAACS with adult, online students suggest that it can be effective with a nontraditional population (Authors, 2018, 2019, 2020, 2021). In this proposal, we present results from a study of the effectiveness of DAACS on student success outcomes, including GPA and term-to-term retention, for traditional-age college students attending a brick-and-mortar university.
Theoretical Framework
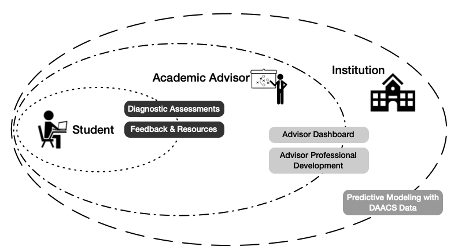
We hypothesized that DAACS would help students fortify the knowledge and skills needed to meet the challenges of higher education and result in increases in achievement-related outcomes. Our theory of change is based on Bronfenbrenner’s bioecological systems theory (1979), which posits that human development is a transactional process in which individuals reciprocally influence spheres of their environment, conceived as a set of nested structures. As shown in Figure 1, the focal individual is the student, including the cognitive skills and academic motivation measured by the DAACS. The academic advisors and institutions that students interact with, directly and indirectly, are also part of the DAACS system: Trained advisors can use DAACS information in advising, and institutions can use DAACS data in predictive models. Thus, DAACS is designed to affect three levels in the system in order to strengthen both the interactions between them and the influences that these interactions have on students’ educational experiences—if they take advantage of them.
Method
Propensity score analysis (PSA) was used with observational data to address the following research questions:
- What are the effects of DAACS on students’ academic success, as measured by GPA?
- What is the predictive power of DAACS as compared to admissions test scores?
Participants
The sample included all students assigned to the online Freshman Orientation (n = 2,389) in Summer 2020 at a Title I research university in the Northeastern region of the United States. Student demographic information is provided in Table 2.
Design and Procedure
As a part of the online orientation program, all students were expected to complete, at a minimum, the DAACS SRL assessment and review their results and personalized feedback in preparation for a meeting with their academic advisors. Students were encouraged to complete and review feedback on all four DAACS assessments. However, there were no consequences for students who did not complete any of the DAACS assessments.
Since all students were offered the same orientation program, propensity score analysis (Rosenbaum & Rubin, 1983) was used to adjust for self-selection bias. The treatment group is defined as students who completed at least one of the four DAACS assessments. Propensity scores is estimated with logistic regression using all the observed covariates (Table 2). Balance is checked by comparing the effect size differences between treatment and control groups both before and after stratification (Helmreich & Pruzek, 2009).
To examine the predictive power of DAACS, correlational analysis is performed using grade point average (GPA), admission test score, and the DAACS assessment score(s). Data Sources
Academic success. Students’ Fall 2020 GPA is the primary measure of academic success for this proposal; term-to-term retention will be included in the final paper. Outcome measures and student demographic information were retrieved from the institution’s Student Information System, deidentified, and provided by the Office of Institutional Research.
Four DAACS assessments with immediate feedback (Table 1). The math and reading assessments are computer-adaptive tests with 18 to 24 multiple-choice items adapted from state-mandated high school English Language Arts and Math exams. These measures of students’ high school level competencies are useful for identifying college readiness (New York State Education Department, 2015a, 2015b).
The SRL survey consists of 47 Likert-scale type items adapted from established SRL measures (Cleary, 2006; Driscoll, 2007; Andrade & Dugan, 2011; Dweck, 2006; Schraw & Dennison, 1994). Forty-seven items cover three domains: metacognition, motivation, and learning strategies. The SRL assessment is valid and reliable with excellent psychometric qualities (Authors, 2019).
The writing assessment prompt asks students to reflect on their SRL survey results by summarizing them and identifying strategies for improving their SRL that they would use during the term. LightSide, an open source, automated essay scoring program, was trained to score the writing assessments in terms of nine criteria related to effective college-level writing (Yagelski, 2015).
Table 1 Four DAACS Assessment Domains, Sub-Domains, and Reliability Indices
| Domain | Sub-domains | Sample Feedback | Reliability |
|---|---|---|---|
| Reading | Ideas, inference, language, purpose, structure | Inferences: “Your results suggest an area of improvement for you is reading closely to determine implied meaning. A skill you may want to improve is the ability to draw logical inferences from what texts say explicitly to determine the implied meaning. An inference is an educated guess about the implied meaning of a passage or text based on a combination of evidence from the text and reasoning.” | α = .68 |
| Writing | Content, organization, paragraphs, sentences, conventions | Organization (Transitions): “Your writing was scored at the developing level for transitions between paragraphs, which were missing or ineffective. Paragraphs tended to abruptly shift from one idea to the next.” | Average LightSide-human IRR=66.3% |
| Mathematics | Word problems, geometry, variables and equations, numbers and calculations, lines and functions | Statistics: “Your results suggest that you have emerging skills for reasoning with data. To further develop your skills at summarizing data with statistics, graphs, and tables, these resources might be a good starting point: …” | α = .68 |
| Self-regulated learning | Metacognition, motivation (anxiety, goal orientation, self-efficacy), learning strategies (help seeking, managing time & environment, strategies for understanding), mindset | Motivation (Anxiety): “The SRL survey results suggest that you have a high level of test anxiety. This means that you tend to worry a lot about how you will perform on exams. You might also feel on edge or have trouble focusing on schoolwork because of worrying.” | α = .79 to .91 |
Results
Data Preparation
Deidentified demographic and outcome data were first merged with their DAACS data. Once the datasets were merged, a treatment indicator was created for which students who had completed at least one DAACS assessment were placed in the treatment group (n = 465; 19.5%) and the remaining students were placed in the comparison group (n = 1,924; 80.5%). Only two of the student variables contained missing values: high-school GPA (7.9%) and admissions test score (4.6%). Missing values were imputed using the mice package (van Buuren & Groothuis-Oudshoorn, 2011) in R. In addition, two dichotomous variables were created to indicate whether the value was imputed and included in models used to estimate propensity scores (Table 1). Only the missing indicator for admission test score was statistically significant (p = 0.01) predictor of treatment, which suggests that the data was not missing at random. To adjust for the missingness, the two indicators were included in the regression models.
Phase I of Propensity Score Analysis
Propensity score is defined as the conditional probability of being in the treatment (Rosenbaum & Rubin, 1983). A logistic regression model was estimated with the treatment variable as the dependent variable and all observed covariates as the independent variables. Fitted values from the logistic regression model serve as the propensity scores. Figure 1 depicts the propensity scores (x-axis) against GPA (y-axis) with marginal distributions on the sides. The density distribution of the propensity scores suggests there is sufficient overlap between the treatment and control groups. The vertical lines depict boundaries for the strata. That is, for stratification, the propensity scores are divided into deciles where the difference is estimated within each stratum and aggregated to provide an overall effect estimate. This is done to both check for balance and estimate the overall effect in phase II. The results of the balance check are summarized in Figure 1 and Table 1. Results suggest that balance was achieved with all adjusted effect sizes below 0.10.
Phase II of Propensity Score Analysis
With good balance achieved in phase I, in phase II the causal effects are estimated using student t-tests. Consistent with Rosenbaum’s (2012) recommendation to test the null hypothesis using more than one method, effect sizes are estimated using stratification and matching on the propensity scores (Sekhon, 2011). For stratification, an independent t-test is performed for each stratum and then aggregated to provide an overall standardized effect estimate of 0.29 (t = 6.27, p < 0.01). For matching, a dependent sample t-test is performed resulting in an overall standardized effect size estimate of 0.35 (t = 14.41, p < 0.01).
Sensitivity Analysis
To test the robustness of the results, a sensitivity analysis was performed (Rosenbaum, 2005) using the rbounds R package (Keele, 2014). The goal is to determine the minimum magnitude (gamma) that an unobserved covariate would need to be before failing to reject the null hypothesis. The rbounds package uses a Wilcoxon Signed Rank significance test, which relaxes the normality assumptions. Table 3 provides the lower and upper bounds of the significance test for values of gamma between 1 and 2. The results suggest that the unobserved covariate would have to increase the likelihood of a control student being in the treatment by a factor of 1.9 before we can fail to reject the null hypothesis that treatment students’ GPA was higher than control students. This suggests that the results are fairly robust to any unobserved covariates.
Prediction
To compare how well DAACS predicted student success as compared to admission test scores, a correlational analysis was performed. Figure 3 is a correlational plot for GPA, admission test score (rescaled to SAT), and the four DAACS assessments. The correlation between SAT and GPA is r = 0.158 (p < 0.01), which is smaller than the correlations between SAT and three of the four DAACS assessments (\rho_{GPA,SRL}=0.162, p < 0.01; \rho_{GPA,Writing}=0.183, p < 0.01; \rho_{GPA,Math}=0.184, p < 0.01).
Discussion
This study is the first use of DAACS with traditional-age college students. Previous studies focused on returning students attending online colleges (Authors, 2019, 2020, 2021). The results of this study are consistent with our previous findings: students who complete DAACS and view the feedback have increased academic success. With institutions decreasing their use of high-stakes assessments as a requirement, no-stakes assessments that offer students feedback regarding critical college skills provide students and institutions with valuable data without the cost and other issues related to high-stakes assessments.
Limitations
As with any quasi-experimental design, unmeasured confoundedness could impact the results. The sensitivity analysis suggests our results are robust to even a moderate level of unmeasured covariates. We have received a large federal grant that will allow us to perform a randomized control trial beginning in Fall 2022.
In addition, the assumptions of some of the statistical tests may not be completely accurate given that GPA is negatively skewed. Wilcox rank sum tests were performed and yielded similar results. For clarity, the parametric tests were included in this proposal.
Significance of the Work
This proposal is part of a large-scale, field-based experiment involving the development, implementation, and evaluation of DAACS. Given that DAACS is a free, open-source assessment-to-feedback system that addresses both academic and SRL skills, it has the potential to enhance the academic and regulatory skills of a large number of college students. This paper represents an attempt to provide empirical evidence for the effectiveness of DAACS in improving critical success outcomes for traditional-age students.
References
Andrade, H. L., Dugan, R. (2011). Exploring the construct validity of academic self-regulation using a new self-report questionnaire–the Survey of Academic Self-Regulation. The International Journal of Educational and Psychological Assessment, 7(1), 45-63. https://scholarsarchive.library.albany.edu/edpsych_fac_scholar/1
Authors (2018, 2019, 2020, 2021).
Bailey, T., & Cho, S-W. (2010). Developmental education in community colleges [Issue Brief]. Community College Research Center, Teachers College, Columbia University. http://ccrc.tc.columbia.edu/DefaultFiles/SendFileToPublic.asp?ft=pdf&FilePath=c:\Websites\ccrc_tc_columbia_edu_documents\332_815.pdf&fid=332_815&aid=47&RID=815&pf=Publication.asp?UID=815
Belfield, C.R., & Crosta, P.M. (2012). Predicting success in college: The importance of placement tests and high school transcripts (CCRC Working Paper No. 42). Community College Research Center, Teachers College, Columbia University. http://ccrc.tc.columbia.edu/Publications?UID-1030
Bronfenbrenner, U. (1979). The ecology of human development: Experiments by nature and design. Harvard University Press.
Cleary, T. J. (2006). The development and validation of the Self-Regulation Strategy Inventory—Self-Report. Journal of School Psychology, 44(4), 307-322. https://doi.org/10.1016/j.jsp.2006.05.002
Driscoll, R. (2007). Westside test anxiety scale validation. American Test Anxiety Association. https://files.eric.ed.gov/fulltext/ED495968.pdf
Dweck, C. S. (2006). Mindset. Random House.
Helmreich, J.E., and Pruzek, R.M (2009). PSAgraphics: An R package to support propensity score analysis. Journal of Statistical Software, 29(6), 1-23. https://www.jstatsoft.org/index.php/jss/article/view/v029i06/v29i06.pdf
Keele, L.J. (2014). rbounds: Perform Rosenbaum bounds sensitivity tests for matched and unmatched data(Version 2.1) [R package]. https://cran.r-project.org/web/packages/rbounds/rbounds.pdf
National Association for College Admission Counseling (2021). Test-optional means test-optional. https://www.nacacnet.org/news--publications/newsroom/test-optional-means-test-optional/
New York State Education Department (2015a, January). New York State Regents examination in algebra 1 (Common Core): 2014 field test analysis, equating procedure, and scaling of operational test forms [Technical Report]. Pearson. http://www.p12.nysed.gov/assessment/reports/
New York State Education Department (2015b, January). New York State Regents examination in ELA(Common Core): 2014 field test analysis, equating procedure, and scaling of operational test forms [Technical Report]. Pearson. http://www.p12.nysed.gov/assessment/reports/
Rosenbaum, P.R., & Rubin, D.B. (1983). The central role of the propensity score in observational studies for causal effects. Biometrika, 70(1), 41-55. https://doi.org/10.1093/biomet/70.1.41
Rosenbaum, P.R. (2005). Sensitivity analysis in observational studies. In B.S. Everitt & D.C. Howell (Eds.), Encyclopedia of Statistical Behavior Science (pp. 1809–1814). John Wiley & Sons. https://citeseerx.ist.psu.edu/viewdoc/download?doi=10.1.1.586.1567&rep=rep1&type=pdf
Rosenbaum, P.R. (2012). Testing one hypothesis twice in observational studies. Biometrika, 99(4), 763-774. https://doi.org/10.1093/biomet/ass032
Schraw, G., & Dennison, R. S. (1994). Assessing metacognitive awareness. Contemporary Educational Psychology, 19(4), 460-475. https://doi.org/10.1006/ceps.1994.1033
Sekhon, J.S. (2011). Multivariate and Propensity Score Matching Software with Automated Balance Optimization: The Matching Package for R. Journal of Statistical Software, 42(7), 1-52. https://ssrn.com/abstract=1009044
van Buuren, S., and Groothuis-Oudshoorn, K (2011). mice: Multivariate imputation by chained equations in R. Journal of Statistical Software, 45(3), 1-67. https://www.jstatsoft.org/index.php/jss/article/view/v045i03/v45i03.pdf
Yagelski, R. (2015). The essentials of writing: Ten core concepts. Cengage Learning.
Zimmerman, B. J., Moylan, A., Hudesman, J., White, N., & Flugman, B. (2011). Enhancing self-reflection and mathematics achievement of at-risk urban technical college students. Psychological Test and Assessment Modeling, 53(1), 141-160. https://citeseerx.ist.psu.edu/viewdoc/download?doi=10.1.1.1084.8313&rep=rep1&type=pdf
Zimmerman, B. J., & Schunk, D. H. (2011). Self-regulated learning and performance: An introduction and overview. In B. J Zimmerman & D. H. Schunk (Eds.), Handbook of self-regulation of learning and performance: Educational psychologyhHandbook. Routledge.